
Projects
Create, edit, delete and share your projects. Read more →
The web dashboard is a complete PhotoReport app, in your browser. You create projects, import plans, place annotations, add photos, videos and audio comments, then generate your reports.
These are the same features as on iPhone, iPad and Android, on the same account and the same data. An annotation placed in the field from a phone appears in the browser, and the reverse is true too.
Address: dashboard.photoreport.app
A PhotoReport account and a recent browser. There is nothing to install.
The dashboard is included in every plan, the free plan included. As on mobile, some features require a subscription:
| Feature | Plan |
|---|---|
| Create projects, plans, annotations, photos | All, with the free plan limited to 1 project |
| Create a report | All, with the free plan limited to 3 reports in total |
| Share a report by protected link | Pro or Teams |
| Logo and contact details on reports | Pro or Teams |
| Custom project colours | Pro or Teams |
| Real-time collaboration | Teams |
See Plans and pricing for the detail.
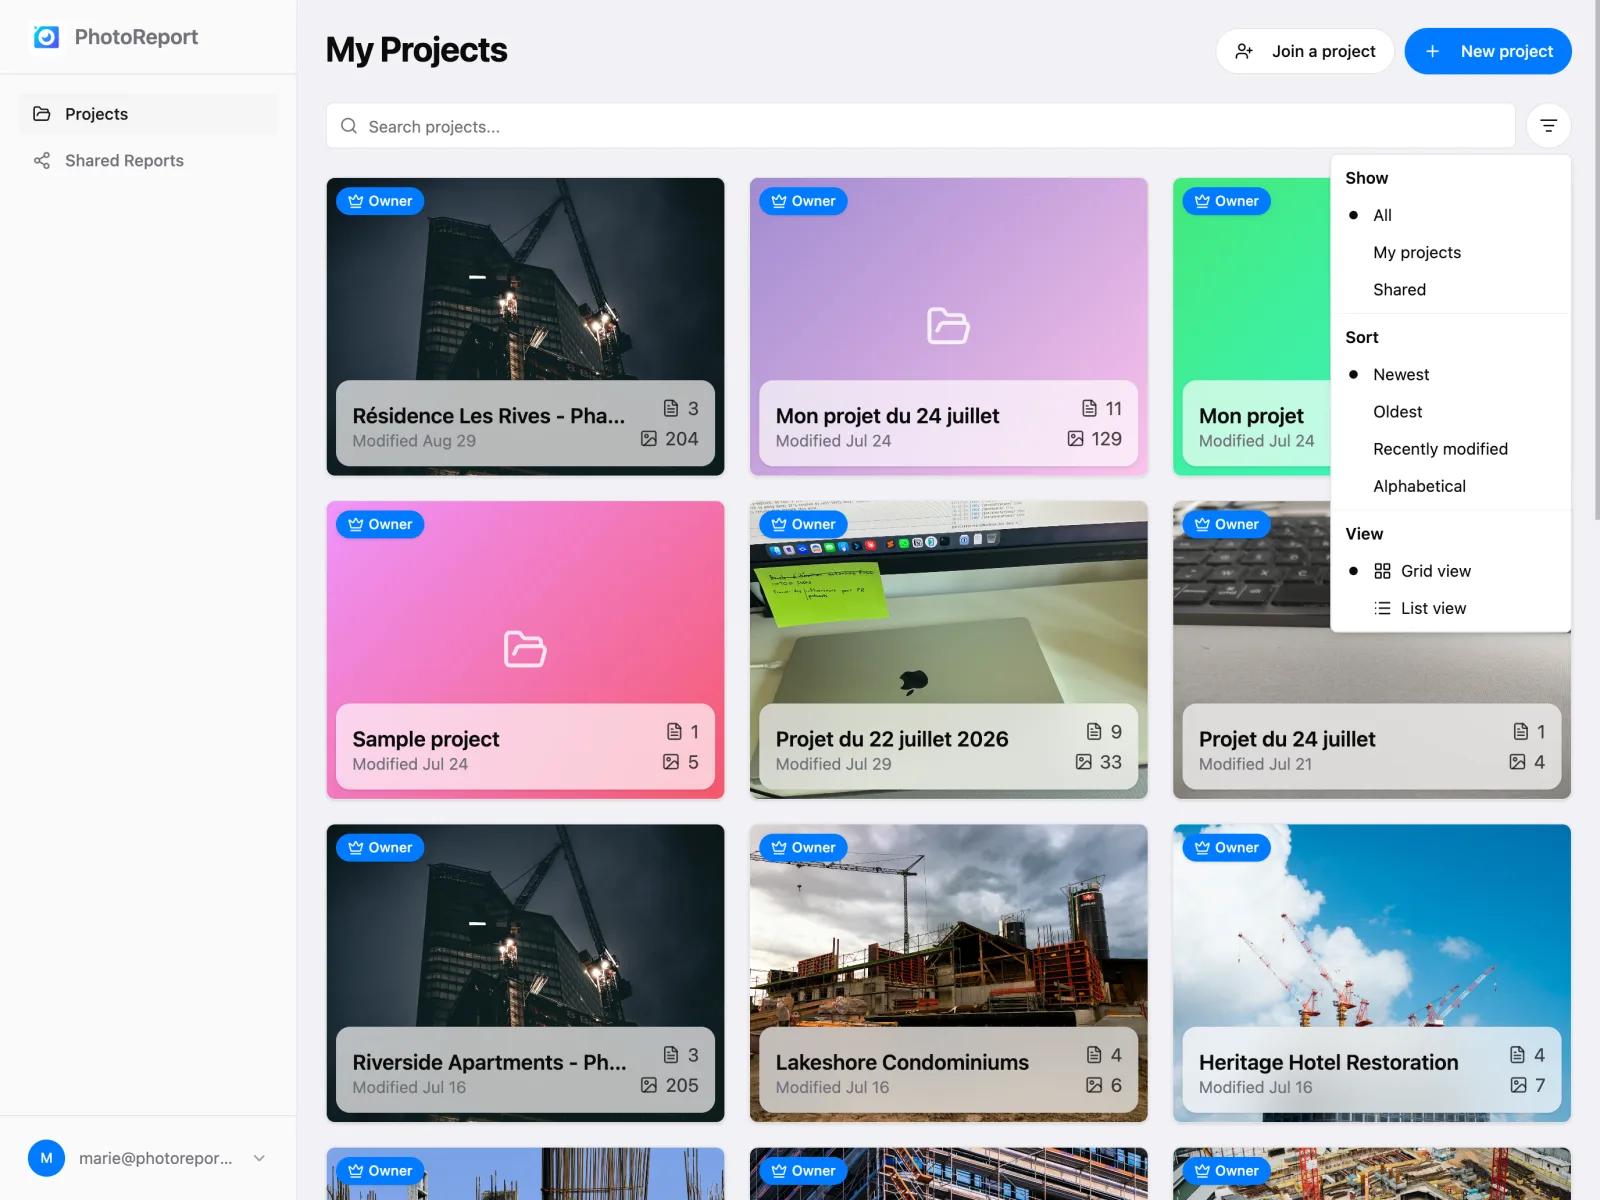
You land straight on My projects, the list of all your projects. There is no intermediate home screen.
If you have no projects yet, this screen offers to create one or to open a sample project already filled in, so you can see what a finished project looks like before putting your own into it.
The side menu gives access to projects, shared reports and settings.
Projects
Create, edit, delete and share your projects. Read more →
Import a plan
Drop in a PDF or an image. A multi-page PDF gives one plan per page. Read more →
Plan viewer
Navigate the plan, zoom, filter annotations. Read more →
Annotations
Place and edit viewpoints, with colour, size and status. Read more →
Photos and videos
Add media to an annotation, rotate it, delete it. Read more →
Draw on a photo
Circle, point and highlight directly on a photo. Read more →
Audio comments
Listen to and manage an annotation’s voice comments. Read more →
Observations
Every viewpoint and general observation in one list, checked before you export. Read more →
Create a report
Filter the content, choose the quality, generate a PDF or a shareable link. Read more →
Shared reports
Track your reports: status, expiry, downloads. Read more →
Company profile
Your logo and contact details on every exported report. Read more →
Settings
Account, subscription, notifications, appearance, privacy. Read more →
Just one, and it comes down to hardware: the browser does not take photos. On the dashboard you add photos and videos from the files on your computer. Shooting happens on your phone or tablet.