
Create a report
This is what the project builds towards: turning plans, viewpoints and photos into a document you can hand over. The dashboard does all the work server-side, you only choose what goes in.
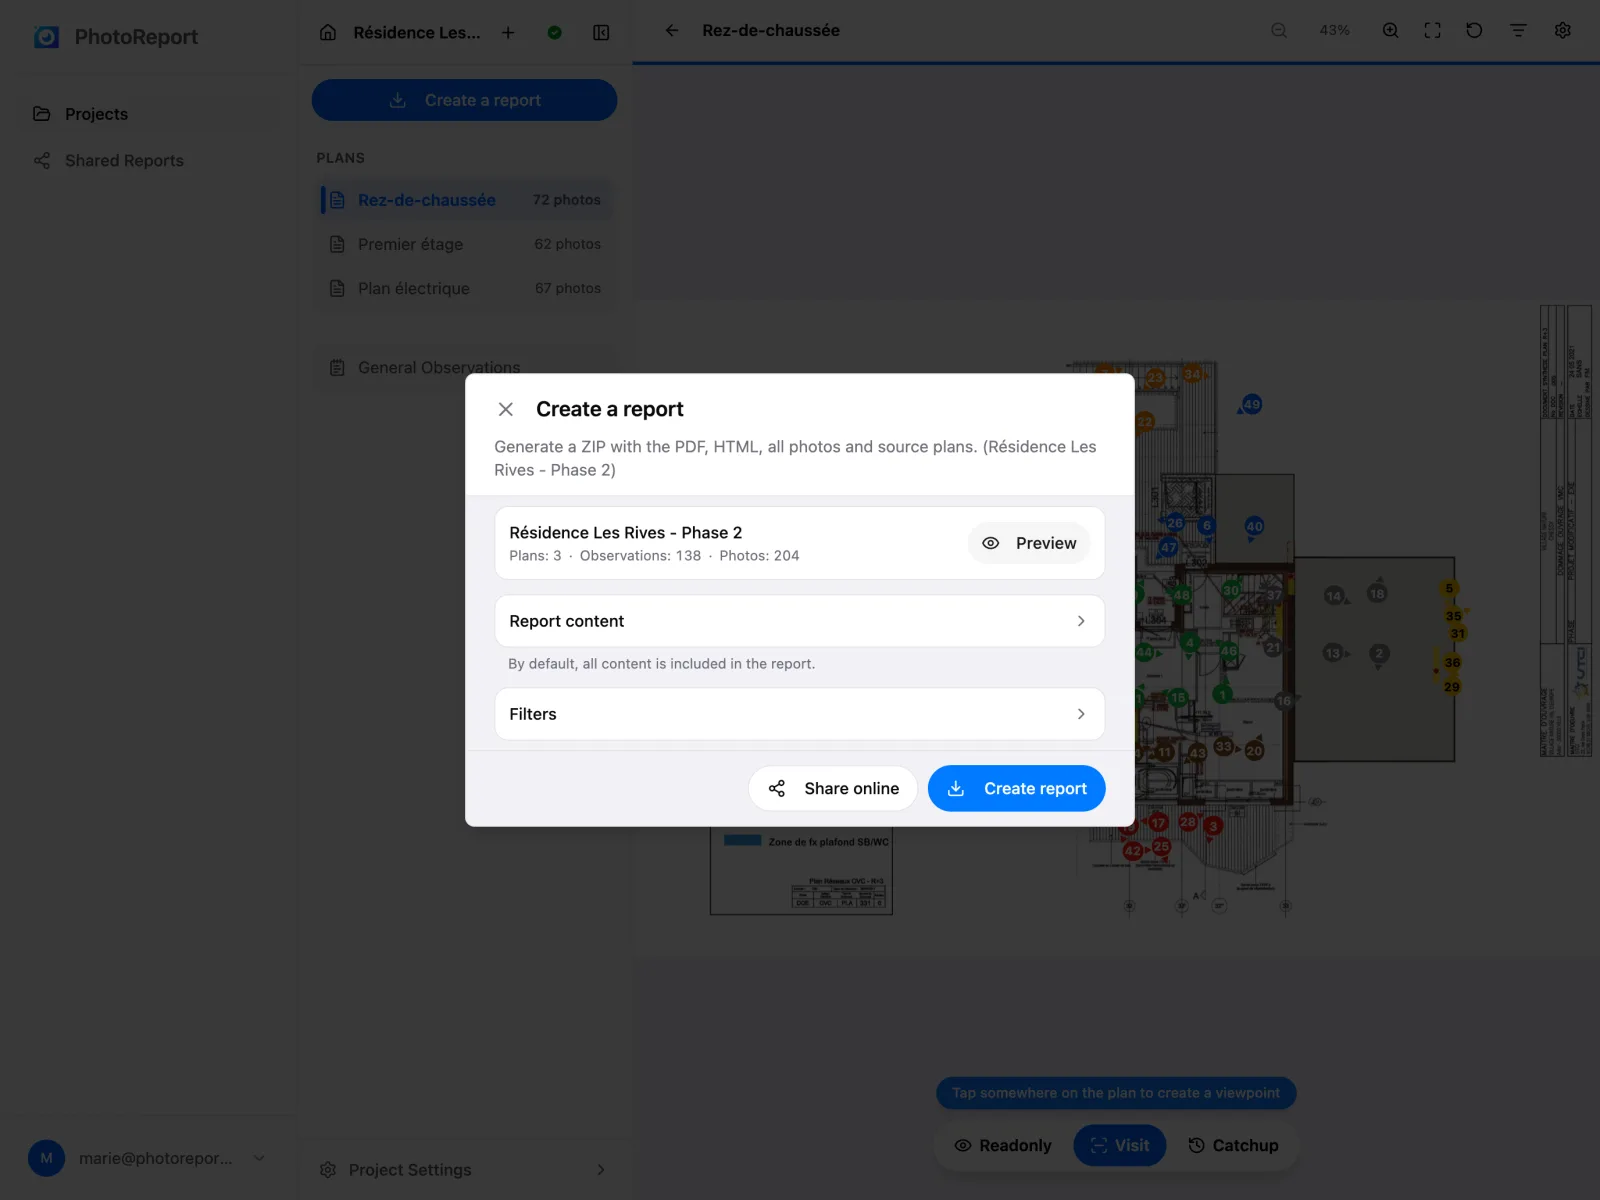
Generating a report
Section titled “Generating a report”- In the project, click Create a report.
- Optionally choose filters and a photo quality.
- Click Create report.
- Follow the progress, then collect the result.
A report contains a PDF, an HTML version you can open in a browser, all the photos and the source plans, gathered in a ZIP archive.
Choosing what goes into the report
Section titled “Choosing what goes into the report”By default, the report covers the whole project. The Filters section lets you narrow it down by several criteria, which stack:
| Filter | Typical use |
|---|---|
| Plans | Deliver only one building, one floor or one trade |
| Activity | Keep only viewpoints from one period, for a visit write-up |
| Creators | Isolate one contributor’s work |
| Media types | Keep only viewpoints with a photo, or conversely spot those with no media |
| Colours | If you use colour as a code, deliver a single category |
| General observations | Include or exclude what is not tied to any plan |
A summary updates live and shows what will be kept, for example “12/37 viewpoints · 48/210 photos”. Clear all filters returns to the complete project.
Photo quality
Section titled “Photo quality”Three levels, which determine the weight of the final file:
| Level | Resolution | When to use it |
|---|---|---|
| Low | around 1280 px | Sending by email, a quick write-up |
| High | around 1920 px | The right compromise in most cases |
| Maximum | original size | When the photo is evidence and must stay usable when zoomed |
Two destinations
Section titled “Two destinations”Save the report
Section titled “Save the report”The ZIP archive is downloaded to your computer. It is then up to you to pass it on, by whatever channel you like.
Share a link
Section titled “Share a link”PhotoReport hosts the report and gives you a password-protected address. The recipient has nothing to install and needs no account.
- Click Share online.
- Set a password, or click Generate a password. Six characters minimum.
- Choose the validity: 7, 30 or 90 days.
- Click Create share link.
- Copy the address and the password.
Sharing online requires a Pro or Teams subscription. See Sharing reports.
The free plan limit
Section titled “The free plan limit”The free plan allows you to create 3 reports in total, by any method. A counter tells you where you stand, for example “2/3 reports created”.
Reports from the sample project count too. See Plans and pricing.
If generation fails
Section titled “If generation fails”| Message | What to do |
|---|---|
| Rendering timed out | Filter to reduce the number of plans or photos, and try again |
| Report too large to generate | Lower the photo quality, or split into several reports |
| This project contains too many photos to export at once | Use the filters to deliver plan by plan |
| Add at least one plan or observation before exporting | The project is empty, there is nothing to put in the report |
| Network error | Check your connection and click Retry |